Last updated on May 17th, 2024 at 10:17 am
:max_bytes(150000):strip_icc()/data-analytics-4198207-1-ad97301587ac43698a095690bc58c4c1.jpg)
Hey, there! So, are you ready to dip your toes into the world of data analysis? Fantastic! Whether you’re a complete beginner or simply want to brush up on your skills, I’ve got you covered. In this post, I’ll walk you through some simple data analysis techniques that are ideal for beginners. We’ll make things easy, plain, and jargon-free, so you can begin analyzing data like an expert in no time. Are you ready to dive in? Let’s go!
Understanding Easy Data Analysis Methods for Starters
What is data analysis?
Okay, let’s start with the basics. Data analysis is all about making sense of the information you have, whether it is numbers, words, or something else different. It’s similar to being a detective, combing through evidence to discover hidden patterns, trends, and insights. Essentially, it is about transforming raw data into valuable knowledge that can be used to make decisions, solve problems, or simply fulfill one’s curiosity.
Types of Data Analysis.
Now that you understand what data analysis is, let us discuss the many types. There are numerous methods for analyzing data, but beginners should start with the fundamentals. Here are some of the most typical varieties you may encounter:
Descriptive analysis is all about summarizing and characterizing your data, addressing questions like “What happened?” or “How does the data look like?
Exploratory Analysis: Think of it as poking around in your data to see what you can discover. It’s like discovering a new city; you never know what hidden gems you’ll find!
Inferential Analysis: This is where things become a little more complex. Inferential analysis entails generating predictions or drawing conclusions based on data, such as forecasting future trends or testing hypotheses.

Data Analysis Process
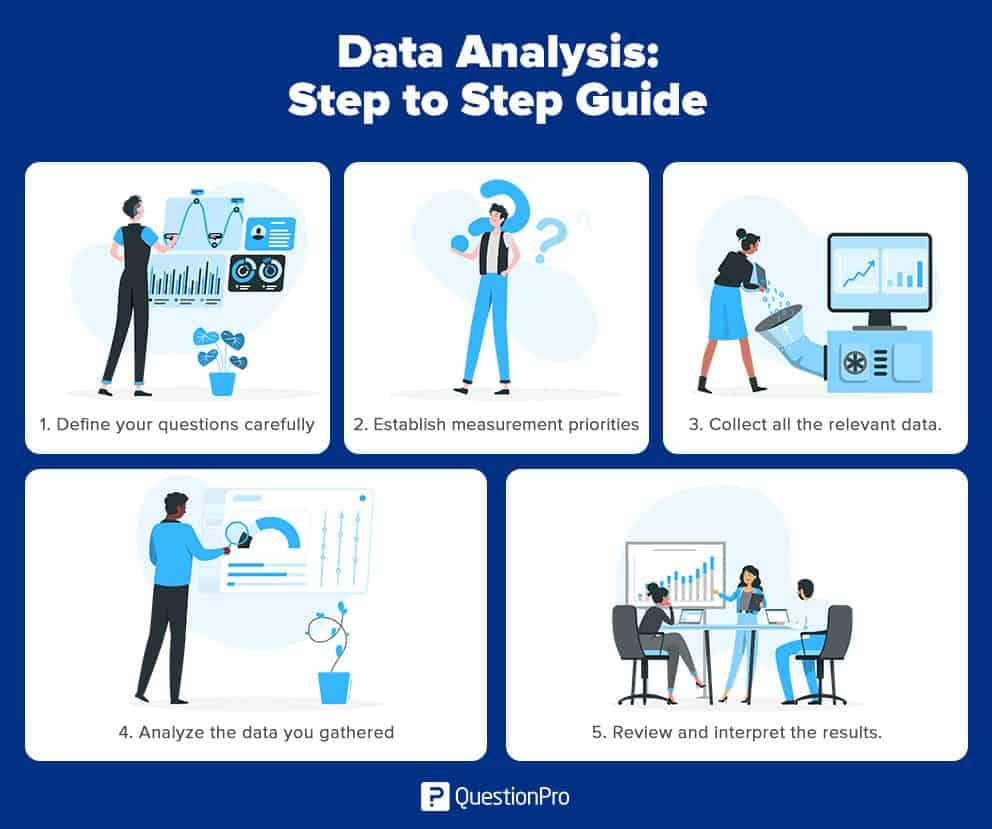
Now that you’ve learned about the many forms of data analysis, let’s discuss the method. Data analysis is similar to baking a cake: you follow a recipe to achieve the best results. Here are the steps.
Define your question. Start by determining what you want to know. What are you seeking to discover or prove?
Collect Your Data: Once you’ve determined your query, it’s time to gather your ingredients – er, data. This could include poll results, sales numbers, or website traffic.
Clean and Prepare Your Data: The next step is to clean and prepare your data for analysis. This includes removing any errors or inconsistencies from your data and ensuring that it is in a usable manner.
Analyze Your Data: Now comes the enjoyable part: evaluating your data! Use the tools and strategies we’ll cover later to delve into your data and discover insights.
Draw conclusions: Finally, make conclusions from your analysis. What have you learned? What does this signify for your company or project?
Data Analysis Tools: Easy data analysis methods for starters
You don’t need a fancy lab or expensive software to analyze data; there are lots of free and simple tools available that are ideal for novices. Here are a few you may wish to look into:
Microsoft Excel: Good old Excel is an essential tool for data analysis. It’s easy, versatile, and most likely already installed on your computer.
Google Sheets: If you prefer working on the cloud, Google Sheets is an excellent choice. It’s similar to Excel, except it also has collaboration functions.
R: R is a sophisticated statistical programming language, but don’t be intimidated! There are plenty of beginner-friendly tutorials and resources available to help you get started.
Python, like R, is a programming language often used for data analysis. It’s more adaptable than R and has a large user and developer base.
Understanding Descriptive Analysis Techniques
Easy data analysis methods for starters: Introduction to Descriptive Statistics
Descriptive statistics are like the foundation of data analysis; they help you grasp the fundamental aspects of your data. There are many different descriptive statistics available, but here are a few that you should be aware of:
Mean: This is simply the average of your data. Add all the numbers together and divide by the total number of values.
The median is the midway value in your data when it is ordered from least to greatest. It’s a reliable measure of central tendency that is unaffected by outliers.
The mode is the value that appears most frequently in your data set. It’s a convenient technique to determine what’s most prevalent.
Range is just the difference between the largest and lowest values in your data. It offers you an indication of how distributed your data is.
Visualizing your data with charts and graphs
When it comes to data analysis, the saying “a picture is worth a thousand words” holds true. Visualizations such as charts and graphs can help you spot patterns and trends in your data that might not be visible if you only looked at statistics. Here are some popular forms of visualizations:
Bar charts are useful for comparing different types of data, such as sales by area or product.
Line Graphs: Line graphs are ideal for displaying trends over time, such as online traffic or market prices.
Pie charts are excellent for displaying proportions, such as the percentage of sales in various product categories.
Scatter Plots: Scatter plots are useful for investigating correlations between two variables, such as age and income or temperature and ice cream sales.
Perform Basic Data Cleaning
Before you can analyze your data, make sure it is clean and ready to use. Data cleaning is removing any errors, inconsistencies, or missing numbers that could skew your study. Here are some common data cleansing tasks:
Removing Duplicates: If your data contains duplicate rows or entries, you should remove them to avoid skewing your results.
Missing values can cause havoc in your analysis, so it’s critical to manage them correctly. Depending on the circumstances, you may delete rows with missing values, impute values using averages or other methods, or leave the missing data as is.
Standardizing Formats: If your data is in different formats or units, you’ll want to standardize it to ensure that you’re comparing like-for-like. This could be converting units, displaying dates consistently, or establishing name conventions.
Checking for outliers: Outliers are data points that deviate dramatically from the rest of your data. While they are occasionally valid and useful, they can also bias your results if not verified. Take the effort to identify and explore any outliers in your data to ensure that they do not skew your analysis.
Application of Basic Statistical Tests
After you’ve cleaned and prepped your data, it’s time to begin analyzing it! There are several statistical tests available, but novices should start with the basics. Here are a few common tests you could encounter:
The T-Test is a basic test for comparing the means of two groups.
. It is commonly used to determine whether there is a significant difference between the means of a control and experimental groups.
The chi-square test determines whether there is a significant relationship between two categorical variables. It is frequently used in market research or surveys to determine the correlations between variables such as gender and product preference.
Correlation assesses the strength and direction of a link between two continuous variables. It is frequently used to investigate the correlations between variables such as height and weight, or temperature and ice cream sales.
Regression analysis is a little more complicated, but it’s an effective method for predicting the relationship between one or more independent factors and a dependent variable. It is widely utilized in domains such as economics, finance, and social science.
Progressing to Inferential Analysis Techniques
Understanding inferential statistics
Now that you’ve mastered descriptive analysis, it’s time to go on to the next level: inference analysis. Inferential statistics allow you to forecast or draw inferences about a population from a sample of data. It’s like taking a small sample of soup and making judgments about the entire pot.
Conduct Hypothesis Testing

Hypothesis testing is a key tool in inferential analysis. Hypothesis testing allows you to determine if an observed impact is statistically significant or just due to chance. This is how it works.
Step 1: Develop Your Hypotheses.
Begin by defining your null hypothesis (H0) and alternative hypothesis (H1). The null hypothesis is typically the default assumption, implying that there is no difference between two groups or no association between two variables. The alternative hypothesis is what you’re attempting to show, such as the existence of a difference or relationship.
Step 2: Choose Your Test.
Next, select the most relevant statistical test for your data and research question. There are numerous tests available, so choose the one that is best suited to your needs.
Step 3: Determine Your Significance Level.
To execute a test, select a significance level (often expressed by alpha). This is the level at which you will consider a result to be statistically significant. Common significance thresholds include 0.05, 0.01, and 0.10.
Step 4: Collect and analyze your data.
After you’ve established your hypotheses and chosen your test, it’s time to collect and analyze the results. Run your statistical test and calculate the p-value, which is the likelihood of seeing your results (or something more extreme) if the null hypothesis is correct.
Step 5: Draw conclusions.
Finally, based on the findings of your test and the significance level you choose, you must determine whether or not to reject the null hypothesis. If the p-value is less than or equal to your significance level, you can reject the null hypothesis while accepting the alternative hypothesis. If the p-value exceeds your significance level, you fail to reject the null hypothesis.
Applying Regression Analysis
Regression analysis is another valuable tool in the inferential analytic toolbox. It enables you to model the link between one or more independent factors and a dependent variable and then make predictions based on that model. This is how it works.
Step 1: Select your variables.
Begin by determining your independent variable(s) – the variables that you believe may impact the dependent variable. Then, choose your dependent variable, which is the variable you want to forecast or explain.
Step 2: Collect Your Data
Next, collect data for your independent and dependent variables. Make sure you have enough data points to achieve relevant results; a decent rule of thumb is to have at least 10 observations for each independent variable.
Step 3: Run Your Regression.
Once you’ve gathered your data, it’s time to perform your regression analysis. There are many different types of regression models available, but novices should begin with simple linear regression. This entails applying a straight line to your data and utilizing it to make predictions.
Step 4: Interpret your results.
Finally, interpret the findings of your regression analysis. Examine the coefficients, p-values, and other statistics to better understand the relationship between your variables and make predictions based on the model.
Exploring Advanced Data Analysis Techniques
Once you’ve mastered the fundamentals of inferential analysis, you might wish to look into more advanced techniques. Here are a few things to consider:
ANOVA: Analysis of variance (ANOVA) is a statistical technique that compares means from different groups. It’s similar to a t-test, but with more than two groups.
Factor analysis is a technique for investigating correlations between data and identifying underlying dimensions or factors. It is commonly used in domains such as psychology and sociology to uncover hidden patterns in data.
Cluster analysis is a technique for organizing comparable items or data into clusters or segments. It is commonly used in market research and customer segmentation to identify various groupings within a population.
Time Series Analysis is a method of examining data that varies over time. It is widely used in industries such as finance, economics, and weather forecasting to detect trends, seasonality, and other patterns in time-varying data.
Practical Tips for Effective Data Analysis.
Start Small and Stay Organized
Data analysis can be overwhelming, especially when you’re just getting started. That’s why it’s critical to begin small and keep organized. Divide your analysis into tiny segments, establish reasonable targets and timetables, and track your progress as you go.
Practice, Practice
As with any talent, data analysis takes practice. The more you do it, the better you will become – so don’t be hesitant to plunge in and begin analyzing data! Look for opportunities to hone your abilities, such as evaluating data for a job assignment, answering a personal research question, or competing in online data analysis competitions.
Seek feedback and collaboration.
Data analysis is typically a collaborative activity, so don’t be afraid to seek criticism and work with others. Share your results with coworkers, mentors, or peers and seek their feedback and guidance. You’d be astonished at how much you can learn from others—and how much they can learn from you!
Continue Learning and Stay Curious
Finally, remember that data analysis is a lifetime endeavor. There’s always something new to learn, a new approach to try, or a new problem to tackle. So stay interested, explore, and never stop learning!
Conclusion
This is a guide to easy data analysis methods for starters approaches. I hope this book has helped to demystify the world of data analysis and given you the confidence to start studying data yourself. Remember, data analysis is all about asking questions, exploring options, and discovering insights, so don’t be afraid to get your hands dirty. With some practice and a lot of curiosity, you’ll be able to analyze data like a pro in no time. Happy analyzing!